Trend chartNew
One metric over time, the way an analytics screen needs it: the period before as a dashed line, an unfinished day drawn dashed, a readout that glides with the pointer, and drag to zoom.
Used forAnalytics overviewsProduct metricsBilling and revenueMonitoring
Install with the shadcn CLI
$ npxnpx shadcn@latest add https://hairlineui.com/r/trend-chart.jsonWhere it’s used
Analytics overviews
Visitors, signups or revenue by day, with the period before beside it.
Product metrics
Daily active users or API calls, zoomed into the week something changed.
Billing and revenue
MRR or payments by week, formatted as money on the scale and in the readout.
Monitoring
Requests or latency by hour, where the current hour isn’t over yet.
What it handles for you
A single-metric chart looks like the easy one, until it has to compare with last period, zoom, say what a point was, and not jump every time a filter changes. That is usually three chart-library plugins and a custom tooltip.
- 01
Changes without jumping
New numbers on the same days morph in place; a new range stretches the old line under the new one.
- 02
The period before
Pass previous and a dashed line draws itself in, with its figure in the readout.
- 03
Unfinished buckets
A last day or hour that ends after now is drawn dashed, so a dip at the end isn’t read as a drop.
- 04
A readout that reads
Date, value, the period before and your own note line in one card that glides beside the pointer.
- 05
Drag to zoom
Drag across the chart and onZoom gets the span, snapped to whole buckets.
- 06
Keyboard and table
One tab stop with arrow keys, Home and End, each point announced, and every value in a hidden table.
Overview
The chart at the top of every analytics page is usually a chart library, a tooltip plugin and a zoom plugin that don't know about each other, and it jumps every time the filter or the range changes. This is one line that knows what changed. Same days with new numbers (a filter) and the line morphs into place while the scale rolls to its new top; new days (a range, a zoom) and the old line stretches to where its days sit on the new axis while the new one fades in over it, so zooming in looks like zooming in. Turn on the period before and a dashed line draws itself in from the left. Point at it and a hairline and a dot follow you, with one readout card gliding beside them: the date morphs, the figures roll, and an optional note line says what was behind that day. Drag across it and Time brush snaps to whole buckets and hands you the span. A last bucket that isn't over yet is drawn dashed, so a dip at the end isn't news.
States
- arrive
- The first time it has data, the line and its wash are revealed from left to right (a clip, 1100ms).
- morph
- New values on the same buckets (a filter): every point tweens to its new height (640ms, ease-out) and the scale's figures roll to the new round top.
- zoom
- New buckets (a range, a zoom, a new interval): the axis eases from the old span to the new one, so the old line stretches or shrinks to where its days sit while it fades out under the new one (640ms). The tick labels crossfade the same way. A change that lands mid-change starts from what is on screen.
- compare
- previous turns on: the dashed line is drawn in from the left (900ms) and fades in; it morphs with the main line after that.
- hover
- A hairline and a dot glide to the nearest bucket (240ms, slight overshoot); the readout card glides beside them and flips to the other side near the edge. Its date morphs letter by letter, the figure rolls, and the note line lifts the old sentence out through a blur as the new one rises in.
- brush
- With onZoom, pressing and dragging draws Time brush's band, snapped to bucket edges, with its first and last day and its length on a tag. Release calls onZoom; spans under one bucket are ignored. Escape cancels.
- unfinished
- When the last bucket ends after now, its segment is drawn dashed (3 5) in the line's colour.
Usage
import { TrendChart } from "@/components/trend-chart";<TrendChart label="Visitors by day" buckets={days} // bucket starts, epoch ms values={visitors} previous={visitorsBefore} unit="visitors" onZoom={({ start, end }) => setRange({ start, end })}/>Works with
Installs with it
In the templates
See it at work in a whole page. The templates ship it in components/hairline/.
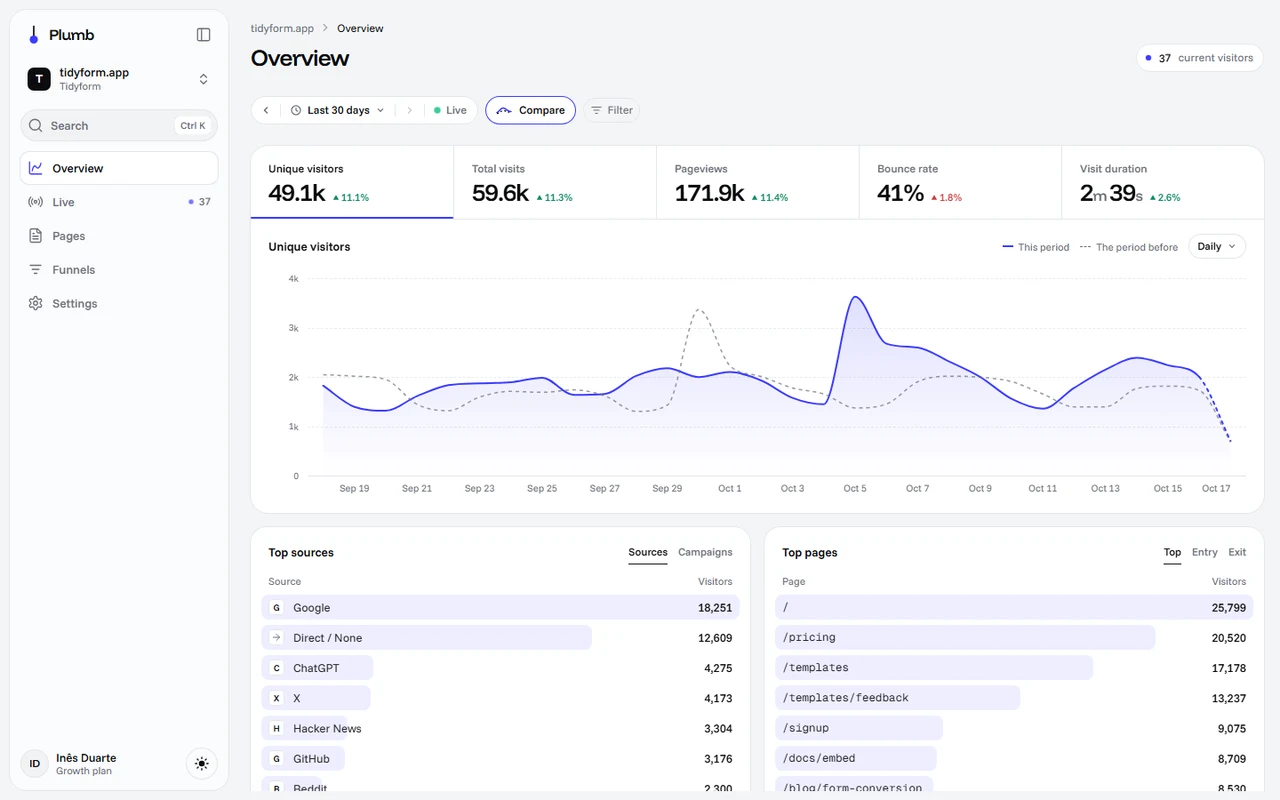
In an analytics overview
Keep the range in state and fetch buckets for it; the chart works out whether the change is a morph or a zoom. Zoom sets the range, Back clears it. The note line can say anything you know about a bucket, here its top source.
"use client";import { useEffect, useState } from "react";import { TrendChart } from "@/components/trend-chart";type Series = { buckets: number[]; values: number[]; previous: number[]; topSource: string[] };export function VisitorsChart({ site, compare }: { site: string; compare: boolean }) { const [zoom, setZoom] = useState<{ start: number; end: number } | null>(null); const [data, setData] = useState<Series | null>(null); useEffect(() => { const range = zoom ?? { start: Date.now() - 30 * 86_400_000, end: Date.now() }; const interval = range.end - range.start <= 2 * 86_400_000 ? "hour" : "day"; const q = new URLSearchParams({ site, from: String(range.start), to: String(range.end), interval }); fetch(`/api/stats/timeseries?${q}`).then((r) => r.json()).then(setData); }, [site, zoom]); if (!data) return null; return ( <section> {zoom && <button onClick={() => setZoom(null)}>Back</button>} <TrendChart label="Visitors" buckets={data.buckets} values={data.values} previous={compare ? data.previous : null} interval={data.buckets.length > 1 && data.buckets[1] - data.buckets[0] < 86_400_000 ? "hour" : "day"} unit="visitors" onZoom={setZoom} note={(i) => (data.topSource[i] ? `Mostly from ${data.topSource[i]}` : null)} /> </section> );}Props
| Prop | Type | Description |
|---|---|---|
| buckets | number[] | Bucket starts in epoch ms, oldest first. Same first bucket, count and interval as before means a morph; anything else is a zoom. |
| values | number[] | One value per bucket. |
| previous | number[] | null | The period before, bucket for bucket. null hides the dashed line. |
| interval | "hour" | "day" | "week" | "month"default "day" | How long one bucket is: sets the last bucket's end, the date words and the shortest span the brush takes. |
| kind | "count" | "percent" | "duration"default "count" | Counts (or money, with format); percentages from 0 to 100; or durations in seconds ("2m 41s", morphed rather than rolled). |
| format | Intl.NumberFormatOptionsdefault { maximumFractionDigits: 0 } | How counts are written in the readout and the table. The scale writes the same format compactly (1.2K, $4.5K). |
| unit | string | What one value is called, after the figure: "visitors". |
| previousLabel | stringdefault "the period before" | How the readout names the dashed line. |
| now | numberdefault the clock at mount | A last bucket that ends after this is unfinished and drawn dashed. |
| onZoom | ({ start, end }) => void | Called with the span dragged across, in epoch ms, snapped to bucket edges. Without it the chart can't be brushed. |
| note | (index) => string | null | A line under the figures in the readout for that bucket. |
| onActiveChange | (index | null) => void | The bucket being read, to highlight the same bucket elsewhere. |
| label | string | Accessible name of the chart and caption of its table. |
| locale | string | For dates and numbers; the viewer's own by default. |
| className | string | On the root. The readout's figure has data-slot="figure" for your display font. |
Accessibility and motion
- The plot is one focusable group: ←/→ move between buckets, Home and End jump to the ends, Escape lets go. Each step is announced in a polite region (date, value, the period before, the note); the pointer path isn't announced.
- Every value is also in a visually hidden table with the period before as a column.
- The line is a monotone cubic, so it never overshoots a point: a day with zero visitors never dips below the axis.
- Its height steps down in narrow containers (a container query), the tick labels thin out to fit, and labels near an edge hang inward instead of running off the card. On touch, pressing reads a bucket; the brush keeps vertical page scroll.
- Reduced motion: no reveal, morph, stretch or glide; the line, the readout and the scale change in place.
Requirements
React 19, Tailwind CSS v4 and shadcn/ui theme variables (any style, light and dark). Icons from lucide-react.
The CLI also installs Number roll, Text morph.
Source
"use client";import * as React from "react";import { NumberRoll } from "./number-roll";import { TextMorph } from "./text-morph";import { TimeBrush } from "./time-brush";/* ───────────────────────────────────────────────────────── * TREND CHART: one metric over time, read by pointer or keys * * change same buckets, new numbers (a filter): the line morphs * into place and the scale rolls. New buckets (a range): * the old line stretches or shrinks to where its days sit * on the new axis while the new one fades in over it, so * zooming in looks like zooming in * compare the period before as a dashed line, drawn in from the * left when it's turned on * hover a hairline and a dot follow the pointer; one readout * card glides beside them, its date morphing and its * figures rolling * drag drag across the chart to zoom into those buckets (Time * brush, snapped to bucket edges) * today a bucket that isn't over yet is drawn dashed, so a dip * at the end isn't news * ───────────────────────────────────────────────────────── */export type TrendInterval = "hour" | "day" | "week" | "month";/** How the figures read: plain counts (or money, with `format`), percentages (0–100) or durations in seconds. */export type TrendKind = "count" | "percent" | "duration";export interface TrendChartProps { /** Bucket starts (epoch ms), oldest first. */ buckets: number[]; /** One value per bucket. */ values: number[]; /** The period before, bucket for bucket; null or left out hides the dashed line. */ previous?: number[] | null; /** How long one bucket is. */ interval?: TrendInterval; kind?: TrendKind; /** Number format for counts, e.g. { style: "currency", currency: "USD" }. The scale writes the same format compactly. */ format?: Intl.NumberFormatOptions; /** What one value is called in a sentence: "3,412 visitors". */ unit?: string; /** How the readout names the dashed line. */ previousLabel?: string; /** The time now (epoch ms): a last bucket that ends after it is unfinished and drawn dashed. The clock at mount by default. */ now?: number; /** Called with the span dragged across. Leave it out and the chart can't be brushed. */ onZoom?: (range: { start: number; end: number }) => void; /** A line under the figures in the readout, e.g. who sent that day's visitors. */ note?: (index: number) => string | null | undefined; /** The bucket the pointer or keys are on, for linking other widgets to the readout. */ onActiveChange?: (index: number | null) => void; /** Accessible name. */ label: string; /** For dates and numbers; the viewer's own by default. */ locale?: string; className?: string;}type Snapshot = { key: string; buckets: number[]; centers: number[]; values: number[]; previous: number[] | null; domain: [number, number]; max: number; partial: boolean; interval: TrendInterval;};const EASE = "cubic-bezier(0.16,1,0.3,1)";const THROW = "cubic-bezier(0.34,1.36,0.64,1)";const DURATION = 640;const TOP = 10;const AXIS = 26;const STEPS = 4;const HOUR = 3_600_000;const DAY = 86_400_000;const WHOLE: Intl.NumberFormatOptions = { maximumFractionDigits: 0 };const reducedQuery = "(prefers-reduced-motion: reduce)";const subscribeReduced = (onChange: () => void) => { const query = window.matchMedia(reducedQuery); query.addEventListener("change", onChange); return () => query.removeEventListener("change", onChange);};const useReducedMotion = () => React.useSyncExternalStore(subscribeReduced, () => window.matchMedia(reducedQuery).matches, () => false);const ease = (t: number) => 1 - Math.pow(1 - t, 4);const lerp = (a: number, b: number, t: number) => a + (b - a) * t;const lerpAll = (a: number[], b: number[], t: number) => b.map((v, i) => lerp(a[i] ?? v, v, t));/** `t` moved on by one bucket, in calendar terms (a day across a clock change is still one day). */function nextBucket(t: number, interval: TrendInterval) { if (interval === "hour") return t + HOUR; const d = new Date(t); if (interval === "month") d.setMonth(d.getMonth() + 1); else d.setDate(d.getDate() + (interval === "week" ? 7 : 1)); return d.getTime();}/** "2m 41s", "48s", "1h 3m". */export function formatDuration(seconds: number) { const s = Math.round(seconds); if (s < 60) return `${s}s`; if (s < 3600) return `${Math.floor(s / 60)}m ${s % 60}s`; return `${Math.floor(s / 3600)}h ${Math.floor((s % 3600) / 60)}m`;}/** A round top for a scale with four steps: 1,840 → 2,000. Durations step in whole minutes. */function niceTop(value: number, kind: TrendKind) { if (value <= 0) return kind === "duration" ? 240 : kind === "percent" ? 100 : STEPS; if (kind === "percent") return Math.min(100, Math.ceil(value / 20) * 20) || 100; const raw = value / STEPS; if (kind === "duration") { const step = [15, 30, 60, 90, 120, 180, 300, 600, 900, 1800].find((s) => s >= raw) ?? Math.ceil(raw / 1800) * 1800; return step * STEPS; } const mag = 10 ** Math.floor(Math.log10(raw)); const step = [1, 1.5, 2, 2.5, 3, 4, 5, 6, 8, 10].map((x) => x * mag).find((s) => s >= raw) ?? 10 * mag; return step * STEPS;}const r2 = (v: number) => Math.round(v * 100) / 100;/** A smooth line that never overshoots its points (monotone cubic), split into segments so the last one can be drawn dashed. */function monotoneSegments(points: [number, number][]) { const n = points.length; if (!n) return { head: "", segments: [] as string[] }; const head = `M${r2(points[0][0])},${r2(points[0][1])}`; if (n === 1) return { head, segments: [] as string[] }; const m: number[] = []; for (let i = 0; i < n - 1; i++) m.push((points[i + 1][1] - points[i][1]) / (points[i + 1][0] - points[i][0] || 1)); const t: number[] = [m[0]]; for (let i = 1; i < n - 1; i++) t.push(m[i - 1] * m[i] <= 0 ? 0 : (m[i - 1] + m[i]) / 2); t.push(m[n - 2]); for (let i = 0; i < n - 1; i++) { if (m[i] === 0) { t[i] = 0; t[i + 1] = 0; continue; } const a = t[i] / m[i]; const b = t[i + 1] / m[i]; const s = a * a + b * b; if (s > 9) { const k = 3 / Math.sqrt(s); t[i] = k * a * m[i]; t[i + 1] = k * b * m[i]; } } const segments: string[] = []; for (let i = 0; i < n - 1; i++) { const [x0, y0] = points[i]; const [x1, y1] = points[i + 1]; const dx = (x1 - x0) / 3; segments.push(`C${r2(x0 + dx)},${r2(y0 + t[i] * dx)} ${r2(x1 - dx)},${r2(y1 - t[i + 1] * dx)} ${r2(x1)},${r2(y1)}`); } return { head, segments };}/** Dates for one locale: the readout's title, the axis ticks and the brush's edges. */function dateWords(locale: string | undefined) { const day = new Intl.DateTimeFormat(locale, { weekday: "short", day: "numeric", month: "short" }); const short = new Intl.DateTimeFormat(locale, { day: "numeric", month: "short" }); const hour = new Intl.DateTimeFormat(locale, { hour: "numeric" }); const clock = new Intl.DateTimeFormat(locale, { hour: "2-digit", minute: "2-digit" }); const month = new Intl.DateTimeFormat(locale, { month: "long", year: "numeric" }); const monthShort = new Intl.DateTimeFormat(locale, { month: "short" }); return { /** "Fri 18 Sep" · "Fri 18 Sep, 2 PM" · "Week of 14 Sep" · "September 2026". */ title: (t: number, interval: TrendInterval) => interval === "hour" ? `${day.format(t)}, ${hour.format(t)}` : interval === "week" ? `Week of ${short.format(t)}` : interval === "month" ? month.format(t) : day.format(t), /** "18 Sep", "2 PM", "Sep". */ tick: (t: number, interval: TrendInterval) => (interval === "hour" ? hour.format(t) : interval === "month" ? monthShort.format(t) : short.format(t)), edge: (t: number, interval: TrendInterval) => (interval === "hour" ? clock.format(t) : interval === "month" ? monthShort.format(t) : short.format(t)), };}function snapshotOf(p: { buckets: number[]; values: number[]; previous: number[] | null; interval: TrendInterval; kind: TrendKind; now: number | null }): Snapshot | null { const n = p.buckets.length; if (!n) return null; const ends = p.buckets.map((b, i) => p.buckets[i + 1] ?? nextBucket(b, p.interval)); return { key: `${p.kind}|${p.interval}|${p.buckets[0]}|${n}|${p.values.join(",")}|${p.previous?.join(",") ?? ""}`, buckets: p.buckets, centers: p.buckets.map((b, i) => (b + ends[i]) / 2), values: p.values, previous: p.previous, domain: [p.buckets[0], ends[n - 1]], max: niceTop(Math.max(0, ...p.values, ...(p.previous ?? [])), p.kind), partial: p.now !== null && ends[n - 1] > p.now + 60_000, interval: p.interval, };}const sameBuckets = (a: Snapshot, b: Snapshot) => a.interval === b.interval && a.buckets.length === b.buckets.length && a.buckets[0] === b.buckets[0];/** * A sentence that changes crossfades whole: the old one lifts away through a blur while the * new one rises in. (Letters of two sentences don't morph well; labels use TextMorph.) */function Swap({ text, reduced, className = "" }: { text: string; reduced: boolean; className?: string }) { const [shown, setShown] = React.useState({ text, key: 0 }); const [leaving, setLeaving] = React.useState<{ text: string; key: number }[]>([]); if (text !== shown.text) { if (shown.text && !reduced) setLeaving((l) => [...l.slice(-2), shown]); setShown({ text, key: shown.key + 1 }); } return ( <span className={`relative block ${className}`}> <span key={shown.key} className="block truncate" ref={(el) => { if (!el || reduced || shown.key === 0 || el.dataset.in) return; el.dataset.in = "1"; el.animate([{ opacity: 0, transform: "translateY(0.3em)", filter: "blur(4px)" }, { opacity: 1, transform: "none", filter: "blur(0px)" }], { duration: 320, delay: 40, easing: EASE, fill: "backwards" }); }} > {shown.text || " "} </span> {leaving.map((l) => ( <span key={l.key} aria-hidden="true" className="pointer-events-none absolute inset-x-0 bottom-0 block truncate" ref={(el) => { if (!el || el.dataset.out) return; el.dataset.out = "1"; el.animate([{ opacity: 1, filter: "blur(0px)" }, { opacity: 0, transform: "translateY(-0.3em)", filter: "blur(4px)" }], { duration: 160, easing: EASE, fill: "forwards" }).onfinish = () => setLeaving((all) => all.filter((x) => x.key !== l.key)); }} > {l.text} </span> ))} </span> );}export function TrendChart({ buckets, values, previous = null, interval = "day", kind = "count", format, unit, previousLabel = "the period before", now: nowProp, onZoom, note, onActiveChange, label, locale, className = "",}: TrendChartProps) { const reduced = useReducedMotion(); const gradientId = `trend-wash-${React.useId().replace(/:/g, "")}`; // Without a `now`, the clock at mount (null on the server, so the first paint matches). const [mountedAt, setMountedAt] = React.useState<number | null>(null); React.useEffect(() => setMountedAt(Date.now()), []); const now = nowProp ?? mountedAt; const target = React.useMemo(() => snapshotOf({ buckets, values, previous, interval, kind, now }), [buckets, values, previous, interval, kind, now]); const [frame, setFrame] = React.useState<{ from: Snapshot | null; to: Snapshot | null; morph: boolean; p: number }>({ from: null, to: null, morph: false, p: 1 }); const drawnRef = React.useRef(frame); drawnRef.current = frame; const [arrived, setArrived] = React.useState(false); const [width, setWidth] = React.useState(0); const [plotH, setPlotH] = React.useState(200); const [active, setActive] = React.useState<number | null>(null); const [keyboard, setKeyboard] = React.useState(false); const [card, setCard] = React.useState({ w: 180, h: 80 }); const plotRef = React.useRef<HTMLDivElement>(null); const boxRef = React.useRef<HTMLDivElement>(null); const cardRef = React.useRef<HTMLDivElement>(null); const words = React.useMemo(() => dateWords(locale), [locale]); const numbers = React.useMemo(() => new Intl.NumberFormat(locale, format ?? WHOLE), [locale, format]); // A new target: start from wherever the drawing is now (mid-change included). React.useLayoutEffect(() => { if (!target) return; const cur = drawnRef.current; if (!cur.to || reduced) { setFrame({ from: null, to: target, morph: false, p: 1 }); if (!cur.to) requestAnimationFrame(() => requestAnimationFrame(() => setArrived(true))); return; } if (cur.to.key === target.key) return; const e = ease(cur.p); const here: Snapshot = cur.from ? { ...cur.to, values: cur.morph ? lerpAll(cur.from.values, cur.to.values, e) : cur.to.values, domain: [lerp(cur.from.domain[0], cur.to.domain[0], e), lerp(cur.from.domain[1], cur.to.domain[1], e)], max: lerp(cur.from.max, cur.to.max, e), } : cur.to; const morph = sameBuckets(here, target); setFrame({ from: here, to: target, morph, p: 0 }); const begin = performance.now(); let raf = 0; const step = (t: number) => { const p = Math.min(1, (t - begin) / DURATION); setFrame((f) => (f.to === target ? { ...f, p } : f)); if (p < 1) raf = requestAnimationFrame(step); }; raf = requestAnimationFrame(step); return () => cancelAnimationFrame(raf); // eslint-disable-next-line react-hooks/exhaustive-deps }, [target?.key, reduced]); // The plot's size comes from CSS (its height steps down in narrow cards). React.useLayoutEffect(() => { const el = boxRef.current; const plot = plotRef.current; if (!el || !plot) return; const measure = () => { setPlotH((h) => (el.offsetHeight - AXIS > 0 && el.offsetHeight - AXIS !== h ? el.offsetHeight - AXIS : h)); setWidth((w) => (plot.offsetWidth === w ? w : plot.offsetWidth)); }; measure(); const observer = new ResizeObserver(measure); observer.observe(el); observer.observe(plot); return () => observer.disconnect(); }, []); React.useLayoutEffect(() => { const el = cardRef.current; if (el && active !== null) setCard((c) => (Math.abs(c.w - el.offsetWidth) < 1 && Math.abs(c.h - el.offsetHeight) < 1 ? c : { w: el.offsetWidth, h: el.offsetHeight })); }); const activeRef = React.useRef<number | null>(null); const setActiveIndex = (i: number | null) => { if (activeRef.current === i) return; activeRef.current = i; setActive(i); onActiveChange?.(i); }; const { from, to, morph, p } = frame; const e = ease(p); const domain: [number, number] = to ? (from ? [lerp(from.domain[0], to.domain[0], e), lerp(from.domain[1], to.domain[1], e)] : to.domain) : [0, 1]; const max = to ? (from ? lerp(from.max, to.max, e) : to.max) : niceTop(0, kind); const x = (t: number) => ((t - domain[0]) / (domain[1] - domain[0] || 1)) * width; const y = (v: number) => TOP + (plotH - TOP) * (1 - Math.min(1.08, v / (max || 1))); // What's drawn: one morphing series, or the old one fading under the new one. const layers: { snap: Snapshot; values: number[]; alpha: number }[] = []; if (to) { if (from && morph) layers.push({ snap: to, values: lerpAll(from.values, to.values, e), alpha: 1 }); else { if (from && p < 1) layers.push({ snap: from, values: from.values, alpha: 1 - e }); layers.push({ snap: to, values: to.values, alpha: from ? e : 1 }); } } const shownValues = layers[layers.length - 1]?.values ?? []; const paths = (snap: Snapshot, vals: number[]) => { const points = snap.centers.map((c, i) => [x(c), y(vals[i] ?? 0)] as [number, number]); const { head, segments } = monotoneSegments(points); const n = points.length; const tail = snap.partial && n > 1; const solid = head + (tail ? segments.slice(0, -1) : segments).join(""); const dashed = tail ? `M${points[n - 2][0]},${points[n - 2][1]}${segments[n - 2]}` : ""; const area = n > 1 ? `${head}${segments.join("")}L${points[n - 1][0]},${plotH}L${points[0][0]},${plotH}Z` : ""; return { solid, dashed, area }; }; const prevPath = (snap: Snapshot, prev: number[]) => { const points = snap.centers.map((c, i) => [x(c), y(prev[i] ?? 0)] as [number, number]); const { head, segments } = monotoneSegments(points); return head + segments.join(""); }; const comparing = !!to?.previous; const [compareShown, setCompareShown] = React.useState(false); React.useEffect(() => { if (!comparing) return setCompareShown(false); const a = requestAnimationFrame(() => requestAnimationFrame(() => setCompareShown(true))); return () => cancelAnimationFrame(a); }, [comparing]); const n = to?.buckets.length ?? 0; const indexAt = (clientX: number) => { const r = plotRef.current?.getBoundingClientRect(); if (!r || !to || !n) return null; const t = domain[0] + ((clientX - r.left) / r.width) * (domain[1] - domain[0]); let best = 0; for (let i = 1; i < n; i++) if (Math.abs(to.centers[i] - t) < Math.abs(to.centers[best] - t)) best = i; return best; }; const onKeyDown = (ev: React.KeyboardEvent) => { if (!n) return; const at = active ?? n - 1; const moves: Record<string, number> = { ArrowLeft: at - 1, ArrowRight: at + 1, Home: 0, End: n - 1 }; if (ev.key === "Escape") return setActiveIndex(null); if (!(ev.key in moves)) return; ev.preventDefault(); setKeyboard(true); setActiveIndex(Math.min(n - 1, Math.max(0, active === null ? at : moves[ev.key]))); }; // Ticks along the bottom: as many as fit, counted back from the newest so it always has one. const ticks = (snap: Snapshot) => { const gap = snap.interval === "hour" ? 52 : 64; const every = width ? Math.max(1, Math.ceil(gap / (width / snap.buckets.length))) : snap.buckets.length; return snap.buckets.map((b, i) => ({ b, i })).filter(({ i }) => (snap.buckets.length - 1 - i) % every === 0); }; const fmt = (v: number) => (kind === "percent" ? `${Math.round(v)}%` : kind === "duration" ? formatDuration(v) : numbers.format(v)); const scale = (f: number) => { const v = (to?.max ?? max) * f; if (kind === "duration") return <TextMorph>{v ? formatDuration(v).replace(/ 0s$/, "") : "0"}</TextMorph>; if (kind === "percent") return <NumberRoll value={v} format={WHOLE} suffix="%" locales={locale} duration={700} />; return <NumberRoll value={v} format={{ ...format, notation: "compact", minimumFractionDigits: 0, maximumFractionDigits: 1 }} locales={locale} duration={700} />; }; // The brush snaps to bucket edges, so what it covers is whole buckets. const brush = React.useMemo(() => (to ? { start: new Date(to.domain[0]), end: new Date(to.domain[1]) } : null), [to]); const snap = (t: number) => { if (!to) return t; const edges = [...to.buckets, to.domain[1]]; let best = edges[0]; for (const edge of edges) if (Math.abs(edge - t) < Math.abs(best - t)) best = edge; return best; }; const minSpan = interval === "hour" ? HOUR : interval === "day" ? DAY - 2 * HOUR : interval === "week" ? 6 * DAY : 27 * DAY; const tag = (d: Date, edge: "start" | "end") => words.edge(edge === "end" && interval !== "hour" ? d.getTime() - 1 : d.getTime(), interval); const activeValue = active !== null ? (to?.values[active] ?? 0) : 0; const activePrev = active !== null ? (to?.previous?.[active] ?? null) : null; const ax = active !== null && to ? x(to.centers[active]) : 0; const ay = active !== null ? y(shownValues[active] ?? 0) : 0; // The card sits beside the dot, on whichever side has room. In a narrow chart with room on // neither side, it moves to the half of the plot the dot isn't in, so it never covers it. const flip = ax + 16 + card.w > width; const cardX = Math.max(0, Math.min(width - card.w, flip ? ax - 16 - card.w : ax + 16)); const cramped = flip && ax - 16 - card.w < 0; const cardY = cramped && ay < plotH / 2 ? Math.max(0, plotH - card.h - 4) : 0; const noteText = active !== null ? (note?.(active) ?? null) : null; const brushable = !!onZoom && !!to && n > 1; return ( <div className={`@container relative [--gutter:34px] [--plot:170px] @[560px]:[--gutter:44px] @[560px]:[--plot:232px] ${className}`}> <div ref={boxRef} className="relative" style={{ height: `calc(var(--plot) + ${AXIS}px)` }}> {/* The scale: hairlines at fixed heights, figures that roll to the new top. */} {Array.from({ length: STEPS + 1 }, (_, k) => 1 - k / STEPS).map((f) => ( <div key={f} aria-hidden="true" className="absolute inset-x-0" style={{ top: TOP + (plotH - TOP) * (1 - f) }}> <span className="absolute left-0 top-0 -translate-y-1/2 whitespace-nowrap text-right text-[10.5px] leading-none tabular-nums text-muted-foreground" style={{ width: "calc(var(--gutter) - 10px)" }}> {to ? scale(f) : null} </span> <div className={`border-t ${f === 0 ? "border-border" : "border-dashed border-border/80"}`} style={{ marginLeft: "var(--gutter)" }} /> </div> ))} <div className="absolute right-0 top-0" style={{ left: "var(--gutter)", height: plotH }}> <TimeBrush start={brush?.start ?? new Date(0)} end={brush?.end ?? new Date(1)} onSelect={({ start, end }) => { setActiveIndex(null); onZoom?.({ start: start.getTime(), end: end.getTime() }); }} snap={snap} formatTime={tag} minSpan={minSpan} disabled={!brushable} className="h-full w-full" > <div ref={plotRef} role="group" tabIndex={0} aria-label={`${label}. Arrow keys read each point${onZoom ? "; drag across the chart to zoom in" : ""}.`} onKeyDown={onKeyDown} onBlur={() => keyboard && (setActiveIndex(null), setKeyboard(false))} onPointerMove={(ev) => { if (ev.buttons & 1 && brushable) return setActiveIndex(null); setKeyboard(false); setActiveIndex(indexAt(ev.clientX)); }} onPointerDown={(ev) => ev.pointerType !== "mouse" && setActiveIndex(indexAt(ev.clientX))} onPointerLeave={(ev) => ev.pointerType === "mouse" && setActiveIndex(null)} className="absolute inset-0 rounded-md outline-none focus-visible:ring-2 focus-visible:ring-ring/40" > <div className="absolute inset-0" style={{ clipPath: arrived ? "inset(-12px -12px -12px -12px)" : "inset(-12px 100% -12px -12px)", transition: reduced ? "none" : `clip-path 1100ms ${EASE}`, }} > <svg aria-hidden="true" width={width} height={plotH} className="absolute inset-0 overflow-visible"> <defs> <linearGradient id={gradientId} x1="0" x2="0" y1="0" y2="1"> <stop offset="0%" stopColor="var(--primary)" stopOpacity="0.16" /> <stop offset="100%" stopColor="var(--primary)" stopOpacity="0" /> </linearGradient> </defs> {width > 0 && layers.map(({ snap, values: vals, alpha }, li) => { const d = paths(snap, vals); return ( <g key={li === layers.length - 1 ? "now" : "was"} opacity={alpha}> <path d={d.area} fill={`url(#${gradientId})`} /> <path d={d.solid} fill="none" stroke="var(--primary)" strokeWidth="2" strokeLinecap="round" strokeLinejoin="round" /> {d.dashed && <path d={d.dashed} fill="none" stroke="var(--primary)" strokeWidth="2" strokeLinecap="round" strokeDasharray="3 5" />} </g> ); })} </svg> </div> {/* The period before: drawn in from the left when comparing starts. */} <div aria-hidden="true" className="pointer-events-none absolute inset-0" style={{ clipPath: compareShown ? "inset(-12px -12px -12px -12px)" : "inset(-12px 100% -12px -12px)", opacity: compareShown ? 1 : 0, transition: reduced ? "none" : `clip-path 900ms ${EASE}, opacity 300ms ${EASE}`, }} > <svg width={width} height={plotH} className="absolute inset-0 overflow-visible"> {width > 0 && layers.map(({ snap, alpha }, li) => snap.previous ? ( <path key={li === layers.length - 1 ? "now" : "was"} d={prevPath(snap, morph && from?.previous && li === layers.length - 1 ? lerpAll(from.previous, snap.previous, e) : snap.previous)} opacity={alpha} fill="none" stroke="var(--muted-foreground)" strokeOpacity="0.7" strokeWidth="1.5" strokeDasharray="4 4" /> ) : null, )} </svg> </div> {/* The pointer: a hairline, a dot, and the readout card beside them. */} <span aria-hidden="true" className="pointer-events-none absolute top-0 w-px bg-foreground/15" style={{ height: plotH, transform: `translateX(${ax}px)`, opacity: active !== null ? 1 : 0, transition: reduced ? "none" : `transform 240ms ${THROW}, opacity 180ms ${EASE}` }} /> <span aria-hidden="true" className="pointer-events-none absolute left-0 top-0 size-2.5 rounded-full bg-primary shadow-[0_0_0_2.5px_var(--background)]" style={{ transform: `translate(${ax - 5}px, ${ay - 5}px) scale(${active !== null ? 1 : 0.4})`, opacity: active !== null ? 1 : 0, transition: reduced ? "none" : `transform 240ms ${THROW}, opacity 180ms ${EASE}`, }} /> <div ref={cardRef} aria-hidden="true" className="pointer-events-none absolute left-0 top-1 z-10 w-max min-w-[148px] max-w-[240px] rounded-[12px] bg-popover px-3 py-2.5 text-popover-foreground shadow-[0_0_0_1px_var(--border)]" style={{ transform: `translateX(${cardX}px) translateY(${cardY + (active !== null ? 0 : 4)}px)`, opacity: active !== null ? 1 : 0, transition: reduced ? "none" : `transform 260ms ${THROW}, opacity 180ms ${EASE}`, }} > <p className="whitespace-nowrap text-[11.5px] text-muted-foreground"> <TextMorph>{active !== null && to ? words.title(to.buckets[active], to.interval) : " "}</TextMorph> </p> <p className="mt-1 flex items-baseline gap-1.5 whitespace-nowrap"> <span data-slot="figure" className="text-[19px] font-semibold leading-none tracking-[-0.03em] tabular-nums"> {kind === "duration" ? ( <TextMorph>{formatDuration(activeValue)}</TextMorph> ) : ( <NumberRoll value={activeValue} suffix={kind === "percent" ? "%" : ""} format={kind === "percent" ? WHOLE : (format ?? WHOLE)} locales={locale} duration={500} /> )} </span> {unit && <span className="text-[12px] text-muted-foreground">{unit}</span>} </p> {activePrev !== null && ( <p className="mt-1.5 flex items-center gap-1.5 whitespace-nowrap text-[11.5px] text-muted-foreground"> <span aria-hidden="true" className="w-3 border-t border-dashed border-muted-foreground" /> <span className="tabular-nums">{fmt(activePrev)}</span> {previousLabel} </p> )} {noteText !== null && <Swap text={noteText} reduced={reduced} className="mt-1.5 border-t border-border pt-1.5 text-[11.5px] text-foreground" />} </div> </div> </TimeBrush> </div> {/* Along the bottom. */} <div aria-hidden="true" className="pointer-events-none absolute right-0 [clip-path:inset(-4px_0)]" style={{ left: "var(--gutter)", top: plotH + 9, height: 16 }}> {width > 0 && layers.map(({ snap, alpha }, li) => ( <div key={li === layers.length - 1 ? "now" : "was"} style={{ opacity: alpha }}> {ticks(snap).map(({ b, i }) => { // Labels near an edge hang inward instead of running off the card. const at = x(snap.centers[i]); const shift = at < 22 ? "0%" : at > width - 22 ? "-100%" : "-50%"; return ( <span key={b} className={`absolute top-0 whitespace-nowrap text-[11px] leading-none transition-colors duration-200 ${active === i && li === layers.length - 1 ? "text-foreground" : "text-muted-foreground"}`} style={{ left: at, transform: `translateX(${shift})` }} > {words.tick(b, snap.interval)} </span> ); })} </div> ))} </div> </div> <p aria-live="polite" className="sr-only"> {keyboard && active !== null && to ? `${words.title(to.buckets[active], to.interval)}: ${fmt(to.values[active] ?? 0)}${unit ? ` ${unit}` : ""}${activePrev !== null ? `, ${fmt(activePrev)} ${previousLabel}` : ""}${noteText ? `. ${noteText}` : ""}` : ""} </p> {to && ( <table className="sr-only"> <caption>{label}</caption> <thead> <tr> <th scope="col">Period</th> <th scope="col">{unit ?? "Value"}</th> {to.previous && <th scope="col">{previousLabel.replace(/^\w/, (c) => c.toUpperCase())}</th>} </tr> </thead> <tbody> {to.buckets.map((b, i) => ( <tr key={b}> <th scope="row">{words.title(b, to.interval)}</th> <td>{fmt(to.values[i] ?? 0)}</td> {to.previous && <td>{fmt(to.previous[i] ?? 0)}</td>} </tr> ))} </tbody> </table> )} </div> );}"use client";import * as React from "react";import { durationShort, wallAt } from "./time-range-parse";/* ───────────────────────────────────────────────────────── * TIME BRUSH: drag across any chart to pick the time under it * * drag a band follows the pointer from where you pressed, * with its start, end and length written on it * release the band's span is passed to onSelect (zoom in), * and the band fades as the chart redraws * cancel Escape, or a drag too short to mean anything * * Wrap a chart whose x axis runs from `start` to `end`. Nothing * re-renders while you drag: the band is moved directly. * ───────────────────────────────────────────────────────── */export interface TimeBrushProps extends Omit<React.HTMLAttributes<HTMLDivElement>, "onSelect"> { /** The time at the chart's left edge. */ start: Date; /** The time at its right edge. */ end: Date; onSelect: (range: { start: Date; end: Date }) => void; /** The shortest span worth selecting, in ms. */ minSpan?: number; /** Rounds a time to the nearest edge the chart can show (a day boundary on a daily chart). The band snaps to it while you drag. */ snap?: (time: number) => number; /** How the band writes its edges; hours and minutes by default. `edge` says which end, so a daily chart can name the last day it covers. */ formatTime?: (time: Date, edge: "start" | "end") => string; timeZone?: string; disabled?: boolean;}const pad = (n: number) => String(n).padStart(2, "0");export function TimeBrush({ start, end, onSelect, minSpan = 60_000, snap, formatTime, timeZone, disabled = false, className = "", children, ...props }: TimeBrushProps) { const rootRef = React.useRef<HTMLDivElement>(null); const bandRef = React.useRef<HTMLDivElement>(null); const fillRef = React.useRef<HTMLSpanElement>(null); const leftRef = React.useRef<HTMLSpanElement>(null); const rightRef = React.useRef<HTMLSpanElement>(null); const tagRef = React.useRef<HTMLSpanElement>(null); const drag = React.useRef<{ x0: number; id: number; left: number; width: number; from: number; to: number } | null>(null); const timeAt = (x: number, width: number) => start.getTime() + (Math.min(Math.max(x, 0), width) / width) * (end.getTime() - start.getTime()); const xAt = (t: number, width: number) => Math.min(Math.max(((t - start.getTime()) / (end.getTime() - start.getTime())) * width, 0), width); const label = (t: number, edge: "start" | "end") => { if (formatTime) return formatTime(new Date(t), edge); const w = wallAt(t, timeZone); return `${pad(w.hour)}:${pad(w.minute)}`; }; const paint = (a: number, b: number, width: number) => { const band = bandRef.current; const tag = tagRef.current; const d = drag.current; if (!band || !tag || !d) return; let left = Math.max(0, Math.min(a, b)); let right = Math.min(width, Math.max(a, b)); d.from = timeAt(left, width); d.to = timeAt(right, width); if (snap) { // The band jumps from edge to edge the chart can show, so what it covers is what you get. d.from = Math.max(start.getTime(), snap(d.from)); d.to = Math.min(end.getTime(), snap(d.to)); left = xAt(d.from, width); right = xAt(d.to, width); } // Transforms only: a 1px fill scaled to the span, and two hairline edges moved into place. fillRef.current!.style.transform = `translateX(${left}px) scaleX(${right - left})`; leftRef.current!.style.transform = `translateX(${left}px)`; rightRef.current!.style.transform = `translateX(${right - 1}px)`; band.style.opacity = right - left > 2 ? "1" : "0"; band.style.transition = "none"; tag.textContent = `${label(d.from, "start")} – ${label(d.to, "end")} · ${durationShort(Math.max(60_000, d.to - d.from))}`; // The tag stays on the chart even when the band is near an edge. const tw = tag.offsetWidth; tag.style.transform = `translateX(${Math.min(Math.max(left + (right - left) / 2 - tw / 2, 0), width - tw)}px)`; }; const finish = (commit: boolean) => { const d = drag.current; const band = bandRef.current; drag.current = null; if (band) { band.style.transition = "opacity 360ms cubic-bezier(0.16,1,0.3,1)"; band.style.opacity = "0"; } if (d && commit && d.to - d.from >= minSpan) onSelect({ start: new Date(d.from), end: new Date(d.to) }); }; React.useEffect(() => { const onKey = (e: KeyboardEvent) => { if (e.key === "Escape" && drag.current) finish(false); }; window.addEventListener("keydown", onKey); return () => window.removeEventListener("keydown", onKey); }); return ( <div ref={rootRef} className={`relative select-none ${disabled ? "" : "cursor-crosshair"} ${className}`} style={{ touchAction: "pan-y" }} onPointerDown={(e) => { if (disabled || e.button !== 0) return; const r = e.currentTarget.getBoundingClientRect(); drag.current = { x0: e.clientX - r.left, id: e.pointerId, left: r.left, width: r.width, from: 0, to: 0 }; }} onPointerMove={(e) => { const d = drag.current; if (!d || e.pointerId !== d.id) return; const x = e.clientX - d.left; if (Math.abs(x - d.x0) > 3 && !e.currentTarget.hasPointerCapture(e.pointerId)) e.currentTarget.setPointerCapture(e.pointerId); paint(d.x0, x, d.width); }} onPointerUp={(e) => { const d = drag.current; if (!d || e.pointerId !== d.id) return; finish(Math.abs(e.clientX - d.left - d.x0) > 6); }} onPointerCancel={() => finish(false)} {...props} > {children} <div ref={bandRef} aria-hidden="true" className="pointer-events-none absolute inset-0 opacity-0"> <span ref={fillRef} className="absolute inset-y-0 left-0 w-px origin-left bg-primary/[0.09] will-change-transform" /> <span ref={leftRef} className="absolute inset-y-0 left-0 w-px bg-primary/70 will-change-transform" /> <span ref={rightRef} className="absolute inset-y-0 left-0 w-px bg-primary/70 will-change-transform" /> <span ref={tagRef} className="absolute -top-6 left-0 whitespace-nowrap rounded-full bg-background px-2 py-0.5 font-mono text-[10.5px] tabular-nums text-foreground shadow-[inset_0_0_0_1px_var(--border)] will-change-transform" /> </div> </div> );}/* ───────────────────────────────────────────────────────── * TIME RANGE PARSE: what "2h" or "yesterday 14:00–16:00" means * * ranges last N (live), since a moment (live), or a fixed * start and end * typed 15m · 2 hours · last 7 days · today · yesterday · * this week · last month · since 9 · since monday · * 14:00–16:00 · 9am to 5pm · yesterday 14:00-16:00 · * 16 oct 14:00 – 17 oct 09:00 · ISO dates * zones wall-clock times are read and written in the zone * you pass (the viewer's own by default) * ───────────────────────────────────────────────────────── */export type TimeRange = /** The last `duration` ms, ending now. */ | { type: "relative"; duration: number } /** From `start` until now. */ | { type: "since"; start: Date } | { type: "absolute"; start: Date; end: Date };export const MINUTE = 60_000;export const HOUR = 60 * MINUTE;export const DAY = 24 * HOUR;type Wall = { year: number; month: number; day: number; hour: number; minute: number };/* ── Zones ─────────────────────────────────────────────── */const formatters = new Map<string, Intl.DateTimeFormat>();function fmt(timeZone?: string) { const key = timeZone ?? ""; let f = formatters.get(key); if (!f) { f = new Intl.DateTimeFormat("en-US", { timeZone, hourCycle: "h23", year: "numeric", month: "numeric", day: "numeric", hour: "numeric", minute: "numeric", second: "numeric", weekday: "short" }); formatters.set(key, f); } return f;}const WEEKDAY = { Sun: 0, Mon: 1, Tue: 2, Wed: 3, Thu: 4, Fri: 5, Sat: 6 } as Record<string, number>;/** The wall clock at an instant in a zone. */export function wallAt(epoch: number, timeZone?: string) { const p: Record<string, string> = {}; for (const part of fmt(timeZone).formatToParts(new Date(epoch))) p[part.type] = part.value; return { year: +p.year, month: +p.month, day: +p.day, hour: +p.hour % 24, minute: +p.minute, second: +p.second, weekday: WEEKDAY[p.weekday] ?? 0 };}/** The instant a wall-clock time happens in a zone (the earlier one when clocks go back). */export function fromWall(w: Wall, timeZone?: string) { const guess = Date.UTC(w.year, w.month - 1, w.day, w.hour, w.minute); const off = (t: number) => { const a = wallAt(t, timeZone); return Date.UTC(a.year, a.month - 1, a.day, a.hour, a.minute, a.second) - Math.floor(t / 1000) * 1000; }; const a = guess - off(guess - 6 * HOUR); const b = guess - off(guess + 6 * HOUR); const fits = (t: number) => { const x = wallAt(t, timeZone); return x.day === w.day && x.hour === w.hour && x.minute === w.minute; }; if (fits(a) && fits(b)) return Math.min(a, b); if (fits(b)) return b; // a fits, or the time falls in a gap where clocks jump: either way, the moment the clock passes it. return a;}const addDays = (w: Wall, n: number): Wall => { const d = new Date(Date.UTC(w.year, w.month - 1, w.day + n)); return { ...w, year: d.getUTCFullYear(), month: d.getUTCMonth() + 1, day: d.getUTCDate() };};const midnight = (w: Wall): Wall => ({ ...w, hour: 0, minute: 0 });/* ── Resolving and stepping ────────────────────────────── */export function resolveTimeRange(range: TimeRange, now = new Date()): { start: Date; end: Date } { if (range.type === "relative") return { start: new Date(now.getTime() - range.duration), end: now }; if (range.type === "since") return { start: range.start, end: now }; return { start: range.start, end: range.end };}export const isLive = (range: TimeRange) => range.type !== "absolute";/** The same length of time, one window earlier (-1) or later (1). A window that would reach now becomes live again. */export function stepTimeRange(range: TimeRange, dir: -1 | 1, now = new Date()): TimeRange { const { start, end } = resolveTimeRange(range, now); const span = end.getTime() - start.getTime(); const nextEnd = end.getTime() + dir * span; if (dir === 1 && nextEnd >= now.getTime() - 30_000) return { type: "relative", duration: span }; return { type: "absolute", start: new Date(start.getTime() + dir * span), end: new Date(nextEnd) };}export const sameRange = (a: TimeRange, b: TimeRange) => a.type === b.type && (a.type === "relative" ? a.duration === (b as typeof a).duration : a.type === "since" ? a.start.getTime() === (b as typeof a).start.getTime() : a.start.getTime() === (b as typeof a).start.getTime() && a.end.getTime() === (b as typeof a).end.getTime());/* ── Words ─────────────────────────────────────────────── */const plural = (n: number, w: string) => `${n} ${w}${n === 1 ? "" : "s"}`;/** "15 minutes", "4 hours", "7 days". */export function durationWords(ms: number) { if (ms < HOUR || ms % HOUR) return plural(Math.round(ms / MINUTE), "minute"); if (ms < 2 * DAY || ms % DAY) return plural(Math.round(ms / HOUR), "hour"); if (ms % (7 * DAY) === 0 && ms / DAY >= 14) return plural(ms / (7 * DAY), "week"); return plural(Math.round(ms / DAY), "day");}/** "15m", "2h", "3d", "1h 30m". */export function durationShort(ms: number) { const m = Math.round(ms / MINUTE); if (m < 60) return `${m}m`; if (m < 48 * 60) return m % 60 ? `${Math.floor(m / 60)}h ${m % 60}m` : `${m / 60}h`; const d = Math.floor(m / 1440); const h = Math.round((m % 1440) / 60); return h ? `${d}d ${h}h` : `${d}d`;}const pad = (n: number) => String(n).padStart(2, "0");const MONTHS = ["Jan", "Feb", "Mar", "Apr", "May", "Jun", "Jul", "Aug", "Sep", "Oct", "Nov", "Dec"];const DAYS = ["Sun", "Mon", "Tue", "Wed", "Thu", "Fri", "Sat"];/** What the picker's pill says. */export function formatTimeRange(range: TimeRange, { now = new Date(), timeZone, hour12 = false, compact = false }: { now?: Date; timeZone?: string; hour12?: boolean; compact?: boolean } = {}) { const time = (w: { hour: number; minute: number }) => (hour12 ? `${w.hour % 12 || 12}${w.minute ? `:${pad(w.minute)}` : ""}${w.hour < 12 ? "am" : "pm"}` : `${pad(w.hour)}:${pad(w.minute)}`); const today = wallAt(now.getTime(), timeZone); const yesterday = addDays(today, -1); const dayName = (w: Wall & { weekday?: number }) => { if (w.year === today.year && w.month === today.month && w.day === today.day) return "Today"; if (w.year === yesterday.year && w.month === yesterday.month && w.day === yesterday.day) return "Yesterday"; const date = `${w.day} ${MONTHS[w.month - 1]}${w.year !== today.year ? ` ${w.year}` : ""}`; return compact ? date : `${DAYS[new Date(Date.UTC(w.year, w.month - 1, w.day)).getUTCDay()]} ${date}`; }; // Narrow places drop the spaces round the dash and the comma after the day. const dash = compact ? "–" : " – "; const comma = compact ? " " : ", "; if (range.type === "relative") return `Last ${durationWords(range.duration)}`; const s = wallAt(range.start.getTime(), timeZone); if (range.type === "since") { if (!s.hour && !s.minute) return dayName(s) === "Today" ? "Today so far" : `Since ${dayName(s)}`; return dayName(s) === "Today" ? `Since ${time(s)}` : `Since ${dayName(s)}${comma}${time(s)}`; } const e = wallAt(range.end.getTime(), timeZone); const sameDay = s.year === e.year && s.month === e.month && s.day === e.day; const nextDay = addDays(s, 1); // Whole days read as days: "Yesterday", "Mon 12 Oct – Wed 14 Oct". if (!s.hour && !s.minute && !e.hour && !e.minute) { if (nextDay.year === e.year && nextDay.month === e.month && nextDay.day === e.day) return dayName(s); return `${dayName(s)}${dash}${dayName(addDays(e, -1))}`; } if (sameDay) return `${dayName(s)}${comma}${time(s)}${dash}${time(e)}`; return `${dayName(s)} ${time(s)}${dash}${dayName(e)} ${time(e)}`;}/* ── Typed ranges ──────────────────────────────────────── */const UNIT: Record<string, number> = { s: 1000, sec: 1000, secs: 1000, second: 1000, seconds: 1000, m: MINUTE, min: MINUTE, mins: MINUTE, minute: MINUTE, minutes: MINUTE, h: HOUR, hr: HOUR, hrs: HOUR, hour: HOUR, hours: HOUR, d: DAY, day: DAY, days: DAY, w: 7 * DAY, wk: 7 * DAY, week: 7 * DAY, weeks: 7 * DAY,};const DAY_WORDS: Record<string, number> = { sun: 0, sunday: 0, mon: 1, monday: 1, tue: 2, tues: 2, tuesday: 2, wed: 3, wednesday: 3, thu: 4, thur: 4, thurs: 4, thursday: 4, fri: 5, friday: 5, sat: 6, saturday: 6 };const MONTH_WORDS: Record<string, number> = Object.fromEntries( ["january", "february", "march", "april", "may", "june", "july", "august", "september", "october", "november", "december"].flatMap((m, i) => [ [m, i + 1], [m.slice(0, 3), i + 1], ]).concat([["sept", 9]]),);function readTime(t: string): { hour: number; minute: number } | null { if (t === "noon" || t === "midday") return { hour: 12, minute: 0 }; if (t === "midnight") return { hour: 0, minute: 0 }; const m = t.match(/^(\d{1,2})(?:[:.h](\d{2}))?\s?(am|pm)?$/); if (!m) return null; let hour = +m[1]; const minute = m[2] ? +m[2] : 0; if (m[3]) { if (hour < 1 || hour > 12) return null; hour = (hour % 12) + (m[3] === "pm" ? 12 : 0); } else if (!m[2] && hour > 24) return null; if (hour > 23 || minute > 59) return null; return { hour, minute };}/** A date word or numbers, relative to today. */function readDate(t: string, today: Wall & { weekday: number }): Wall | null { if (!t || t === "today") return midnight(today); if (t === "yesterday") return midnight(addDays(today, -1)); if (t in DAY_WORDS) { const back = (today.weekday - DAY_WORDS[t] + 7) % 7; return midnight(addDays(today, -back)); } let m = t.match(/^(\d{4})-(\d{2})-(\d{2})$/); if (m) return { year: +m[1], month: +m[2], day: +m[3], hour: 0, minute: 0 }; m = t.match(/^(\d{1,2})(?:st|nd|rd|th)? (?:of )?([a-z]+)(?: (\d{4}))?$/) ?? null; if (m && MONTH_WORDS[m[2]]) return { year: m[3] ? +m[3] : today.year, month: MONTH_WORDS[m[2]], day: +m[1], hour: 0, minute: 0 }; m = t.match(/^([a-z]+) (\d{1,2})(?:st|nd|rd|th)?(?:,? (\d{4}))?$/); if (m && MONTH_WORDS[m[1]]) return { year: m[3] ? +m[3] : today.year, month: MONTH_WORDS[m[1]], day: +m[2], hour: 0, minute: 0 }; return null;}const TIME_TAIL = /\s*(noon|midday|midnight|\d{1,2}(?:[:.h]\d{2})?\s?(?:am|pm)?)$/;const ISO_MOMENT = /^\d{4}-\d{2}-\d{2}[t ]\d{2}:\d{2}/;/** "yesterday 14:00", "16 oct", "9am", "2026-10-16 14:00" as a wall time. */function readMoment(text: string, today: Wall & { weekday: number }, fallbackDate?: Wall): { wall: Wall; dated: boolean; timed: boolean } | null { const t = text.trim(); if (ISO_MOMENT.test(t)) { const [d, tm] = t.split(/[t ]/); const date = readDate(d, today); const time = readTime(tm.slice(0, 5)); return date && time ? { wall: { ...date, ...time }, dated: true, timed: true } : null; } const tail = t.match(TIME_TAIL); let datePart = t; let time: { hour: number; minute: number } | null = null; if (tail) { const candidate = readTime(tail[1].replace(/\s/g, "")); // "16 oct" ends in digits that aren't a time; only take the tail when what's left is a date (or nothing). const rest = t.slice(0, tail.index).trim().replace(/,$/, ""); if (candidate && (rest === "" || readDate(rest, today))) { time = candidate; datePart = rest; } } const date = datePart ? readDate(datePart, today) : (fallbackDate ?? midnight(today)); if (!date) return null; return { wall: { ...date, ...(time ?? { hour: 0, minute: 0 }) }, dated: Boolean(datePart), timed: Boolean(time) };}/** Reads a typed range, or null. */export function parseTimeRange(input: string, { now = new Date(), timeZone }: { now?: Date; timeZone?: string } = {}): TimeRange | null { const t = input.toLowerCase().trim().replace(/\s+/g, " ").replace(/[–—]/g, "-"); if (!t) return null; const today = wallAt(now.getTime(), timeZone); const at = (w: Wall) => new Date(fromWall(w, timeZone)); // Durations: 15m, 2 hours, last 7 days. const dur = t.match(/^(?:last |past )?(\d+(?:\.\d+)?) ?([a-z]+)$/); if (dur && UNIT[dur[2]]) return { type: "relative", duration: Math.round(+dur[1] * UNIT[dur[2]]) }; const bare = t.match(/^(?:last (minute|hour|day)|past (minute|hour|day|week))$/); if (bare) return { type: "relative", duration: UNIT[bare[1] ?? bare[2]] }; if (t === "today") return { type: "since", start: at(midnight(today)) }; if (t === "yesterday") return { type: "absolute", start: at(midnight(addDays(today, -1))), end: at(midnight(today)) }; if (t === "this week") return { type: "since", start: at(midnight(addDays(today, -((today.weekday + 6) % 7)))) }; if (t === "last week") { const monday = midnight(addDays(today, -((today.weekday + 6) % 7))); return { type: "absolute", start: at(addDays(monday, -7)), end: at(monday) }; } if (t === "this month") return { type: "since", start: at({ ...midnight(today), day: 1 }) }; if (t === "last month") { const first = { ...midnight(today), day: 1 }; const prev = new Date(Date.UTC(first.year, first.month - 2, 1)); return { type: "absolute", start: at({ ...first, year: prev.getUTCFullYear(), month: prev.getUTCMonth() + 1 }), end: at(first) }; } // Since a moment: since 9, since monday, since 16 oct 14:00. const since = t.match(/^(?:since|from) (.+)$/); if (since && !/ (?:to|until|-) /.test(since[1]) && !/\d-\d/.test(since[1])) { const m = readMoment(since[1], today); if (!m) return null; const start = at(m.wall); return start.getTime() < now.getTime() ? { type: "since", start } : null; } // A span: "a - b", "a to b", or two times joined by a bare hyphen ("yesterday 14:00-16:00"). const body = t.replace(/^(?:from|between) /, ""); let span = body.split(/ (?:-|to|until|and) /); if (span.length !== 2) { const tight = body.match(/^(.*?\d{1,2}(?:[:.]\d{2})?\s?(?:am|pm)?)-(\d{1,2}(?:[:.]\d{2})?\s?(?:am|pm)?)$/); span = tight ? [tight[1], tight[2]] : []; } if (span.length === 2) { // "yesterday 14:00-16:00": the date on the left carries over to a time-only right side. const a = readMoment(span[0], today); if (!a) return null; const b = readMoment(span[1], today, midnight(a.wall)); if (!b) return null; let start = a.wall; let end = b.wall; if (!b.timed && b.dated) end = addDays(end, 1); // "16 oct - 17 oct" includes the 17th if (fromWall(end, timeZone) <= fromWall(start, timeZone)) end = addDays(end, 1); // 22:00-02:00 runs past midnight // Times without a date that haven't happened yet today mean yesterday's. if (!a.dated && fromWall(start, timeZone) > now.getTime()) { start = addDays(start, -1); end = addDays(end, -1); } return { type: "absolute", start: at(start), end: at(end) }; } // A single day: monday, 16 oct. const day = readMoment(t, today); if (day && day.dated && !day.timed) return { type: "absolute", start: at(day.wall), end: at(addDays(day.wall, 1)) }; if (day && day.timed && !day.dated) return { type: "since", start: at(day.wall) }; return null;}Registry item: /r/trend-chart.json